Sustainability Analytics
Measuring emissions, efficiency and environmental impact across energy systems to support decarbonization, operational improvement and transparent sustainability decision-making.
What It Is
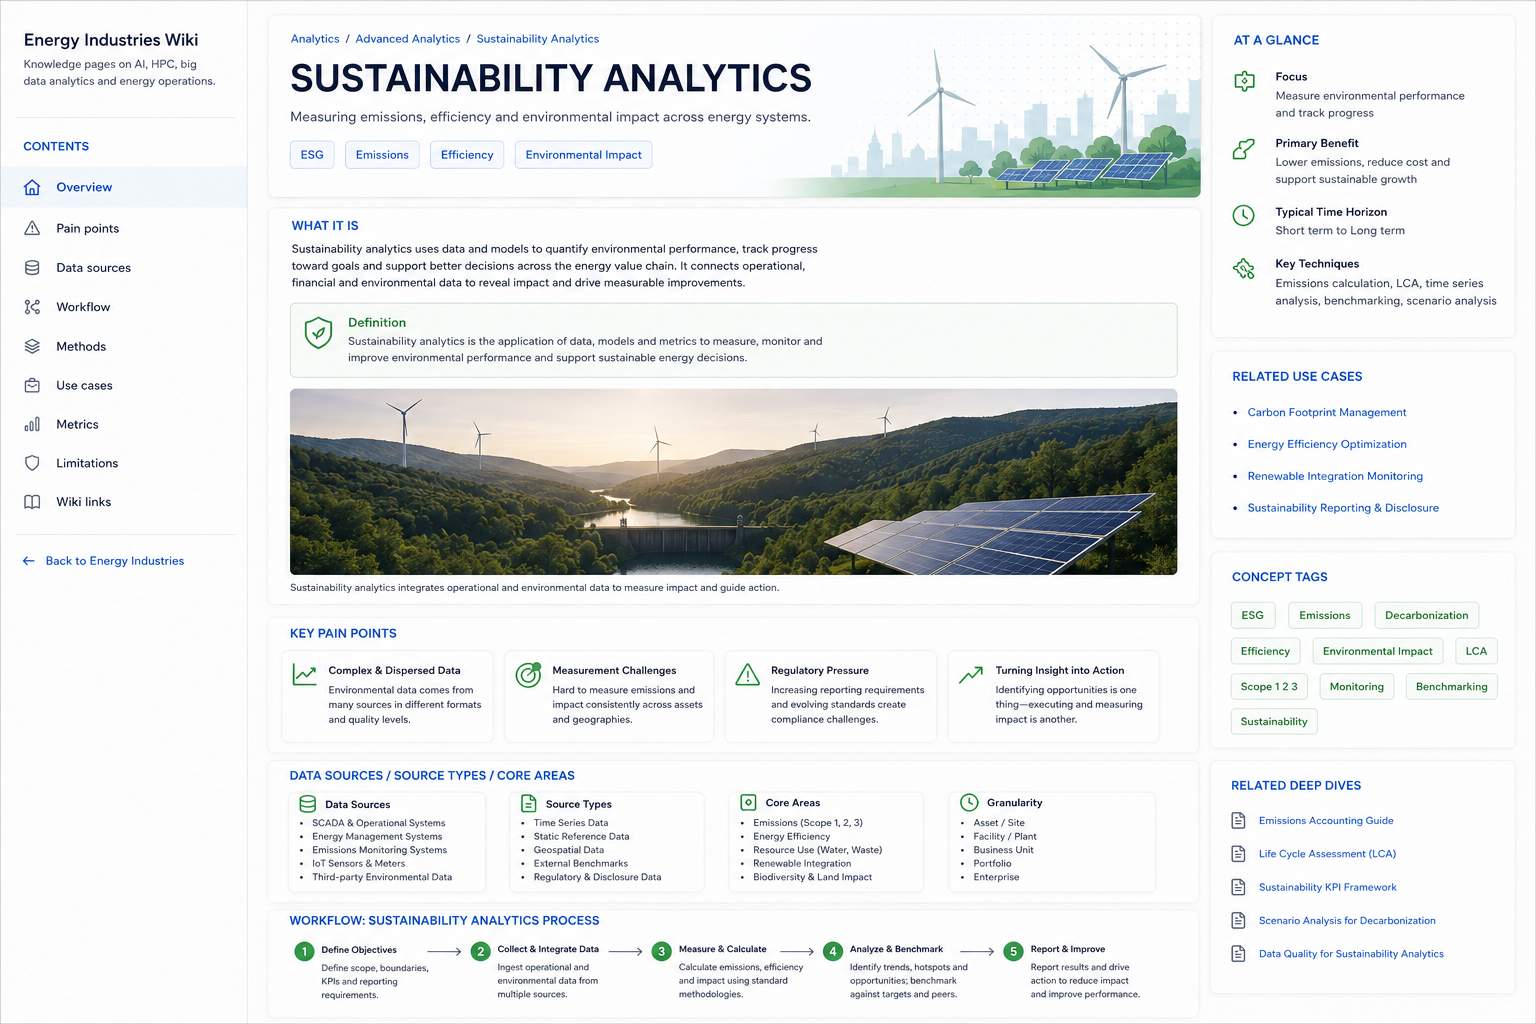
Sustainability analytics uses operational, environmental and financial data to quantify emissions, resource efficiency and environmental impact across energy systems. It helps organizations understand where impact is created, how performance changes over time and which actions can improve measurable outcomes.
In energy operations, sustainability analytics connects generation mix, asset performance, fuel consumption, grid losses, resource use, emissions factors and site-level activity data. The objective is to provide transparent, decision-ready insight rather than generic sustainability claims.
Key Pain Points
Environmental performance is often difficult to measure consistently because data comes from many systems, formats, sites and business units. Analytics creates structure, but the underlying assumptions must be transparent.
Data Sources and Core Areas
Sustainability analytics requires trusted operational data, clear calculation logic and traceable boundaries. The same metric can produce different results if scope, geography or time period is not defined consistently.
| Source Type | Typical Data | Analytical Value |
|---|---|---|
| Operational systems | Generation output, grid losses, fuel use, production volumes, asset runtime and maintenance activity. | Links sustainability impact to real operating behavior and asset performance. |
| Emissions and factor data | Scope 1, Scope 2 and selected Scope 3 factors, location-based and market-based electricity factors. | Supports consistent emissions calculation and comparison across sites and time periods. |
| Resource and environmental data | Water use, waste streams, land impact, biodiversity indicators, heat, noise and local environmental measurements. | Extends analysis beyond carbon to broader environmental impact. |
| Finance and reporting data | Cost centers, investment plans, procurement data, sustainability targets and disclosure structures. | Connects environmental performance to financial planning, reporting and improvement programs. |
Workflow
A practical sustainability analytics workflow starts with clear boundaries and ends with measurable improvement actions, not only reporting outputs.
Methods, Architecture and Controls
Sustainability analytics must combine analytical methods with governance controls so that outputs remain explainable, auditable and operationally useful.
Use Cases and Operational Impact
Sustainability analytics supports both reporting and operational improvement when metrics are connected to assets, processes and actions.
| Use Case | Sustainability Analytics Role | Operational Impact |
|---|---|---|
| Carbon footprint management | Measures emissions across assets, sites and activities using defined scopes and factor logic. | Supports transparent tracking of emissions reduction initiatives and target progress. |
| Energy efficiency optimization | Identifies inefficient assets, avoidable losses and abnormal resource intensity. | Helps prioritize operational improvements, maintenance actions and modernization programs. |
| Renewable integration monitoring | Tracks renewable share, curtailment, storage contribution and carbon intensity over time. | Improves planning for decarbonization pathways and grid balancing strategies. |
| Environmental impact tracking | Combines water, waste, land, biodiversity and local impact indicators with energy operations. | Provides a broader view of sustainability risks and improvement opportunities. |
Key Performance Metrics
Sustainability metrics should be consistent, traceable and connected to operational drivers. They should show both current state and progress over time.
Limitations & Practical Considerations
Sustainability analytics can improve transparency, but it does not remove uncertainty from emissions factors, boundaries, supplier data, market-based calculations or environmental impact assumptions. Results should always be documented with methodology and known limitations.
Common challenges include inconsistent source data, changing calculation methods, missing supplier information, different reporting boundaries and difficulty linking high-level sustainability KPIs to specific operational actions.
Related Deep Dives
Sustainability analytics connects with data governance, trend analysis, energy efficiency and scenario planning because environmental impact must be measured consistently and interpreted over time.