Trend Analysis
Tracking long-term changes in demand, production and system performance to support planning, investment decisions and operational strategy in energy systems.
What It Is
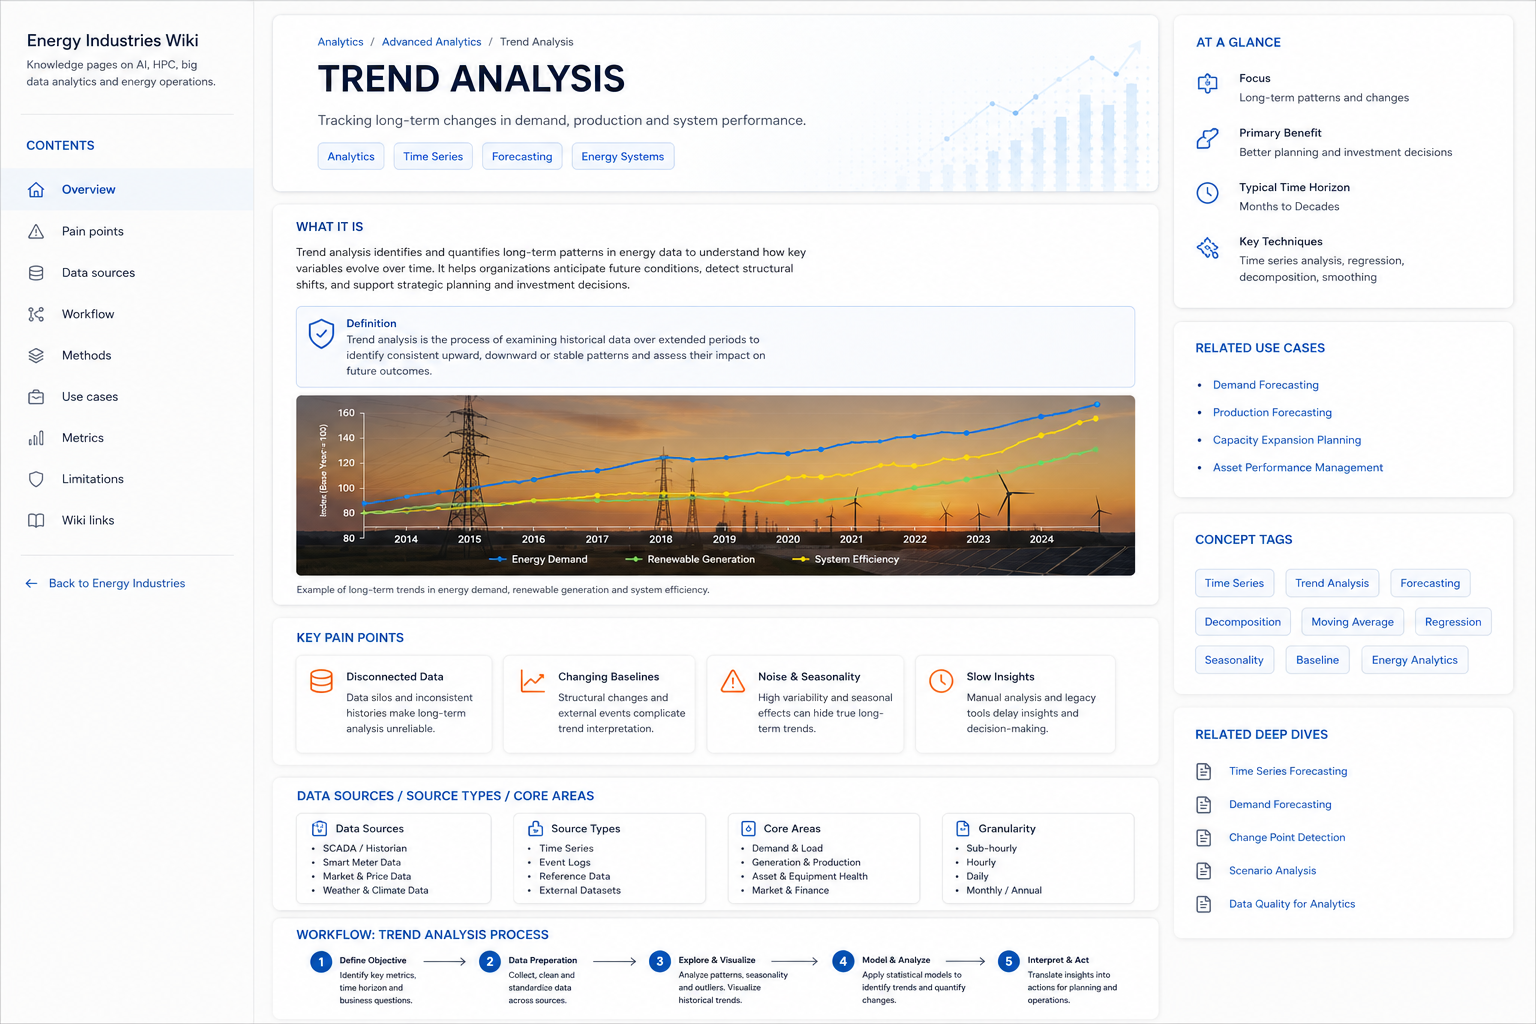
Trend analysis examines how energy-related metrics change over longer periods of time. It helps organizations identify whether demand, production, asset performance, market exposure or system efficiency is moving upward, downward or remaining structurally stable.
In energy operations, trend analysis supports planning by separating long-term movement from short-term noise, seasonal variation and one-off events. It helps teams understand where capacity pressure is building, where production behavior is changing, and where performance degradation may require action.
Key Pain Points
Long-term changes are often difficult to identify because operational teams are surrounded by short-term fluctuations, seasonal effects and fragmented reporting views.
Data Sources and Core Areas
Trend analysis requires consistent historical datasets, stable definitions and enough time depth to distinguish structural changes from temporary variation.
| Source Type | Typical Data | Trend Value |
|---|---|---|
| Demand and load history | Metering, feeder loads, peak demand, customer segments and regional consumption profiles. | Shows growth, decline, peak-shifting and emerging capacity pressure. |
| Production and generation data | Renewable output, conventional generation, storage cycles, curtailment and availability records. | Tracks production mix changes, intermittency patterns and long-term utilization. |
| System performance data | Losses, congestion, outages, voltage quality, reliability indicators and asset performance. | Reveals degradation, improvement or structural stress across infrastructure. |
| Contextual datasets | Weather, climate indicators, market prices, regulatory events, maintenance history and investment timelines. | Helps explain why trends appear and prevents misleading interpretation. |
Workflow
A practical trend analysis workflow creates a repeatable process for comparing historical movement, validating assumptions and translating signals into planning evidence.
Methods, Architecture and Controls
Trend analysis becomes reliable when analytical methods are combined with transparent assumptions, versioned datasets and expert review.
Use Cases and Operational Impact
Trend analysis supports strategic and operational decisions where long-term movement matters more than isolated events.
| Use Case | Trend Analysis Role | Operational Impact |
|---|---|---|
| Demand planning | Tracks long-term consumption growth, peak behavior and structural load shifts. | Supports grid reinforcement, capacity planning and demand response strategy. |
| Production forecasting context | Analyzes long-term changes in generation mix, renewable output and asset utilization. | Improves planning assumptions for balancing, storage and investment cases. |
| Asset performance management | Identifies gradual efficiency loss, reliability changes or recurring degradation patterns. | Helps prioritize maintenance, replacement and modernization programs. |
| System performance review | Compares reliability, losses, congestion and quality indicators over time. | Provides evidence for operational improvement, investment review and executive reporting. |
Key Performance Metrics
Metrics should measure whether trend insights are robust, explainable and useful for planning decisions rather than simply producing charts.
Limitations & Practical Considerations
Trend analysis can support better planning, but it does not guarantee future outcomes. Long-term energy trends can be affected by weather extremes, market shocks, policy changes, technology adoption, asset changes and data quality limitations.
Teams should document assumptions, compare multiple time horizons and review whether the historical period is still representative. Trend outputs should be combined with scenario analysis, domain expertise and operational context.
Related Deep Dives
Trend analysis connects closely with demand forecasting, load analytics, production forecasting and scenario analysis because long-term movement is often the basis for future planning assumptions.