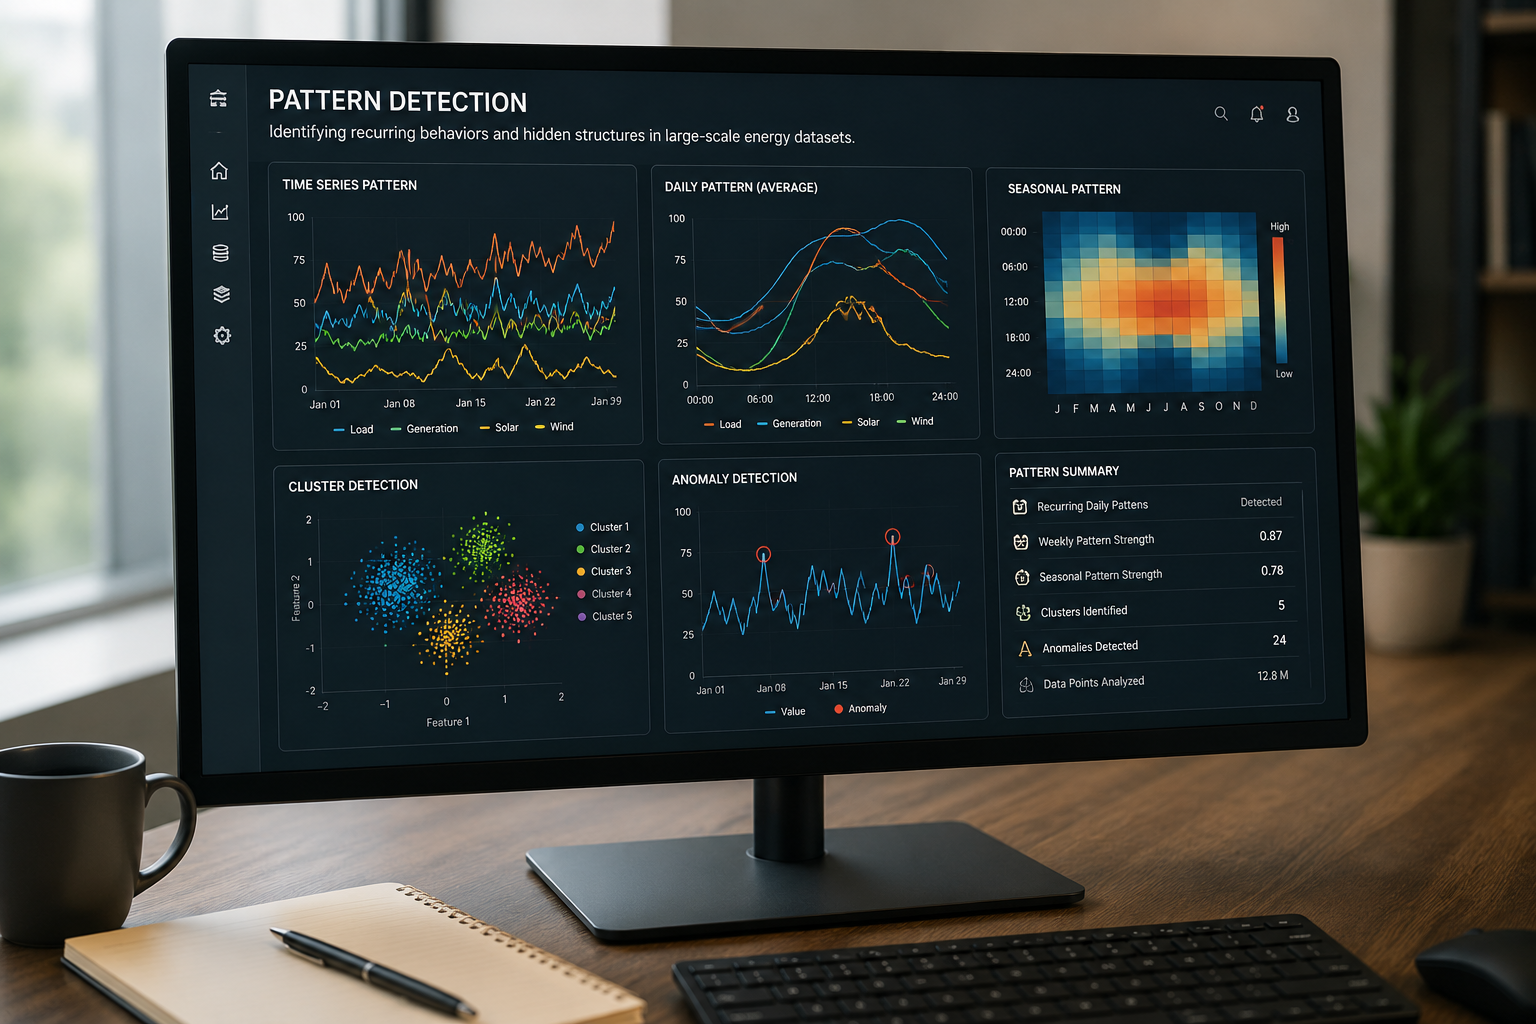
Pattern Detection
Identifying recurring behaviors and hidden structures in large-scale energy datasets to support operational intelligence, anomaly awareness and better planning decisions.
What It Is
Pattern detection analyzes large-scale energy datasets to find recurring behaviors, structural similarities, seasonal effects, operational signatures and unusual deviations. It helps teams move beyond isolated measurements and understand how assets, networks and demand groups behave over time.
In energy operations, pattern detection can reveal repeated load shapes, production cycles, weather-driven consumption effects, hidden equipment behavior, grid stress indicators or emerging operational clusters. The purpose is not to fully automate decisions, but to provide decision-ready evidence from complex data streams.
Key Pain Points
Energy datasets are often high-volume, noisy and spread across different operational domains. Important behaviors can remain hidden when data is reviewed only through averages, static reports or isolated alarms.
Data Sources and Core Areas
Pattern detection depends on consistent time alignment, metadata quality and sufficient historical depth. Source data should be validated before model outputs are used for operational decisions.
| Source Type | Typical Data | Analytical Value |
|---|---|---|
| Load and consumption data | Meter readings, feeder loads, customer segments, peak demand and interval data. | Reveals recurring demand profiles, usage clusters and structural load shifts. |
| Generation and renewable data | Solar, wind, hydro, storage output, curtailment events and forecast deviations. | Identifies production patterns, intermittency signatures and forecast-relevant behavior. |
| Asset telemetry | Temperature, vibration, pressure, voltage, current, breaker events and equipment states. | Supports detection of equipment operating modes, degradation signals and repeated fault precursors. |
| Context and external data | Weather, market prices, grid events, maintenance logs, topology and calendar effects. | Explains why patterns occur and improves interpretation of recurring behaviors. |
Workflow
A practical pattern detection workflow transforms raw operational data into interpretable groups, recurring signatures and actionable indicators.
Methods, Architecture and Controls
Pattern detection combines statistical methods with scalable data architecture and clear controls for model interpretation, retraining and operational use.
Use Cases and Operational Impact
Pattern detection is useful when repeated structures are more important than single events. It can support planning, monitoring and maintenance teams across the energy value chain.
| Use Case | Pattern Detection Role | Operational Impact |
|---|---|---|
| Load profile analysis | Identifies recurring consumption shapes across regions, feeders, facilities or customer groups. | Supports capacity planning, demand response targeting and peak-load management. |
| Renewable generation behavior | Detects repeated production signatures, forecast bias and weather-dependent output structures. | Improves planning assumptions for storage, balancing and grid integration. |
| Asset condition monitoring | Finds repeated telemetry signatures that may indicate operating modes, wear or fault precursors. | Helps maintenance teams prioritize inspections and investigate recurring equipment behavior. |
| Operational event mining | Connects alarms, switching events, outages and contextual data into recurring event sequences. | Improves root-cause analysis and reduces repeated operational disturbances. |
Key Performance Metrics
Metrics should measure whether detected patterns are reliable, interpretable and operationally relevant. High model complexity alone is not a useful success indicator.
Limitations & Practical Considerations
Pattern detection can reveal useful structures, but it can also surface correlations without clear operational meaning. Teams should avoid treating every cluster, cycle or anomaly as an actionable finding without domain validation.
Practical limitations include missing metadata, changing asset configurations, weather normalization challenges, inconsistent sampling rates, data drift and incomplete historical context. Detected patterns should be documented with assumptions, confidence levels and known data gaps.
Related Deep Dives
Pattern detection connects naturally with load analytics, demand forecasting, grid analytics and data governance because patterns only become useful when they are trusted, explainable and connected to operational context.