Load Analytics
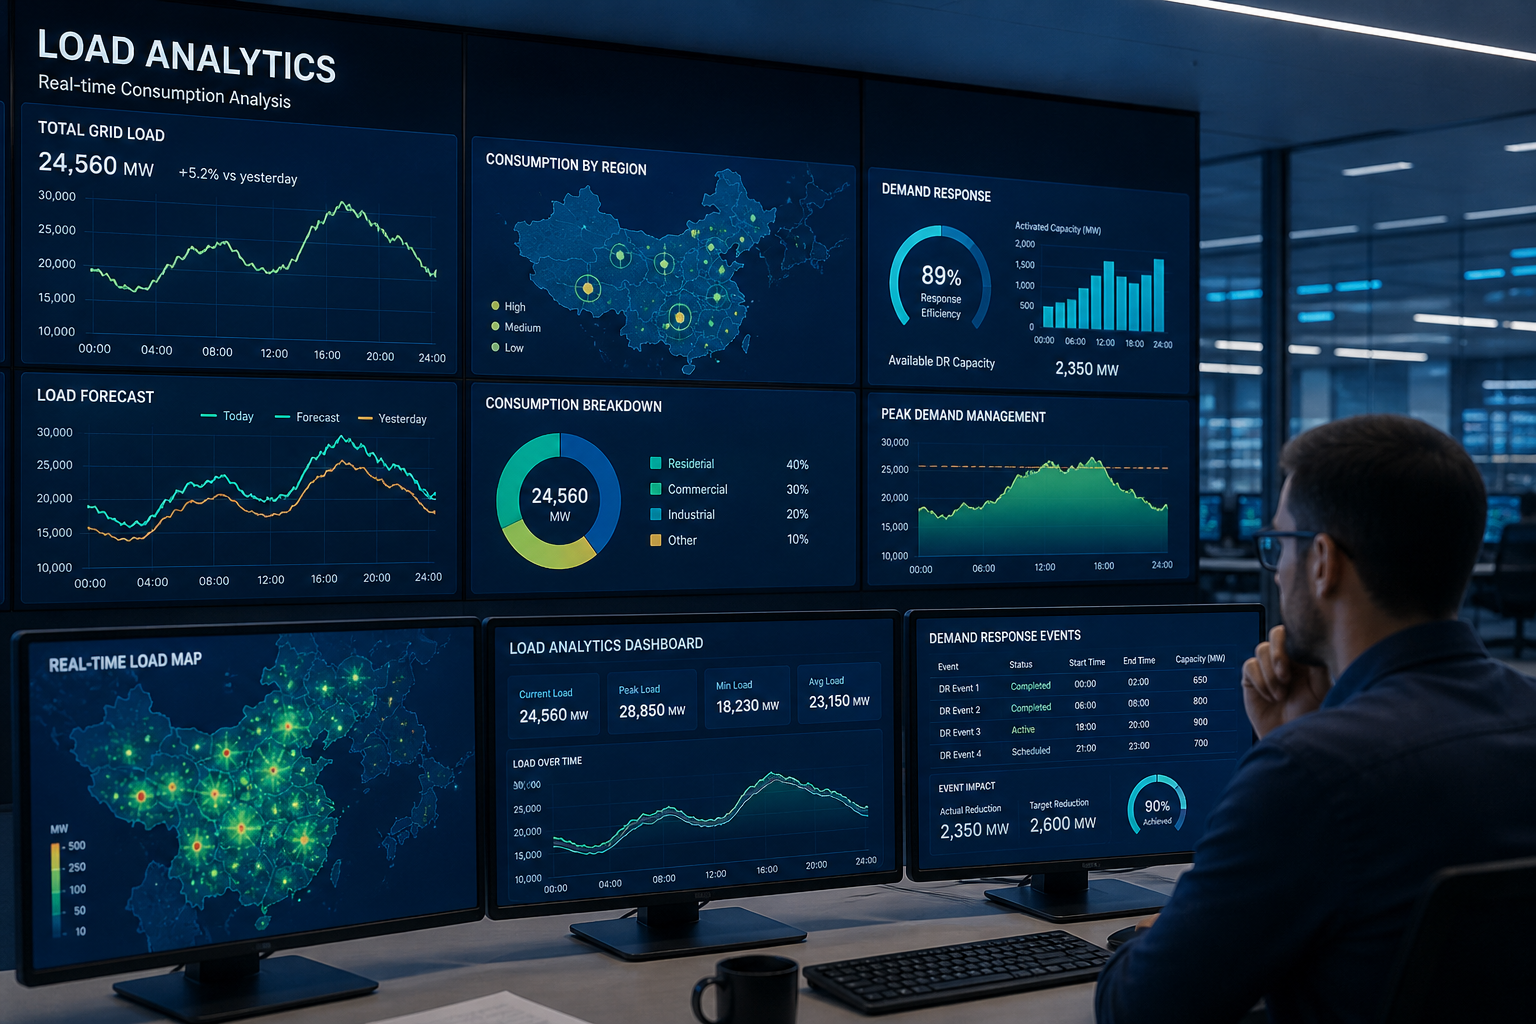
Load analytics analyzes electricity consumption patterns across time, locations, customer groups and grid zones. It supports demand response, peak load reduction, grid planning and better utilization of existing energy infrastructure.
What It Is
Load analytics turns consumption data into operational insight. It identifies when, where and why energy demand changes, helping utilities, grid operators and energy managers understand peak periods, load profiles and flexibility potential.
Unlike general demand forecasting, load analytics focuses on the structure of demand: recurring patterns, local constraints, customer behavior, peak drivers and opportunities to shift or reduce load.
Key Pain Points
Electricity demand is increasingly dynamic due to electrification, weather sensitivity, EV charging, distributed generation and changing consumer behavior.
Data Sources
Load analytics depends on combining consumption measurements with contextual data. The more granular and contextual the data, the better the insight into load drivers and flexibility.
| Data Source | What It Explains | Typical Use |
|---|---|---|
| Smart meter data | Customer-level or feeder-level consumption over time | Load profiles, peak detection, customer segmentation |
| SCADA and grid telemetry | Substation, feeder and asset-level operational conditions | Grid loading, congestion risk, constraint identification |
| Weather data | Temperature, humidity, solar irradiance and extreme conditions | Weather-sensitive demand analysis and forecast adjustment |
| Customer and asset metadata | Customer type, tariff, equipment, location and grid connection | Segmentation, targeting and flexibility program design |
Analytics Workflow
A practical load analytics workflow connects raw consumption data to action: forecasts, demand response programs, grid planning and operational decisions.
Analytics Methods
Load analytics combines statistical analysis, machine learning and domain knowledge about grid operations and customer behavior.
Demand Response & Grid Usage
Load analytics is a foundation for demand response. It identifies which loads are flexible, when flexibility is useful and how much impact response actions produce.
| Use Case | Load Analytics Contribution |
|---|---|
| Peak shaving | Identifies peak drivers and targets controllable loads during high-demand periods. |
| Demand response programs | Finds customers or sites with reliable flexibility potential. |
| Grid planning | Highlights feeders, substations or regions where demand growth may require upgrades. |
| Tariff design | Supports time-of-use or dynamic pricing structures aligned with system constraints. |
Key Performance Metrics
Load analytics should be measured by the quality of insight and its impact on grid performance, cost and flexibility.
Limitations & Practical Considerations
Load analytics depends heavily on data quality, measurement granularity and context. Aggregated data may hide local constraints, while customer-level data raises privacy and governance considerations.
Analytics should be validated against actual operational outcomes. A detected pattern only creates value when it leads to reliable decisions, such as better forecasting, effective demand response or targeted grid investment.
Related Deep Dives
Load analytics connects AI intelligence with smart charging, demand intelligence, grid management and real-time analytics.