Smart Grid Management
Smart grid management describes the monitoring, forecasting and control of electricity networks under changing generation, demand and infrastructure conditions. It combines grid telemetry, weather data, power-flow models and automated decision systems to keep the grid stable, efficient and resilient.
Transmission & Stability Pain Points
Modern grids are becoming more difficult to operate because electricity now flows from many decentralized and variable sources. Wind parks, solar plants, batteries, electric vehicles and flexible industrial loads all change the behavior of the network.
The core challenge is not only producing enough energy. The grid must continuously maintain frequency stability, avoid transmission bottlenecks and recover safely from disturbances.
Autonomous Frequency Control
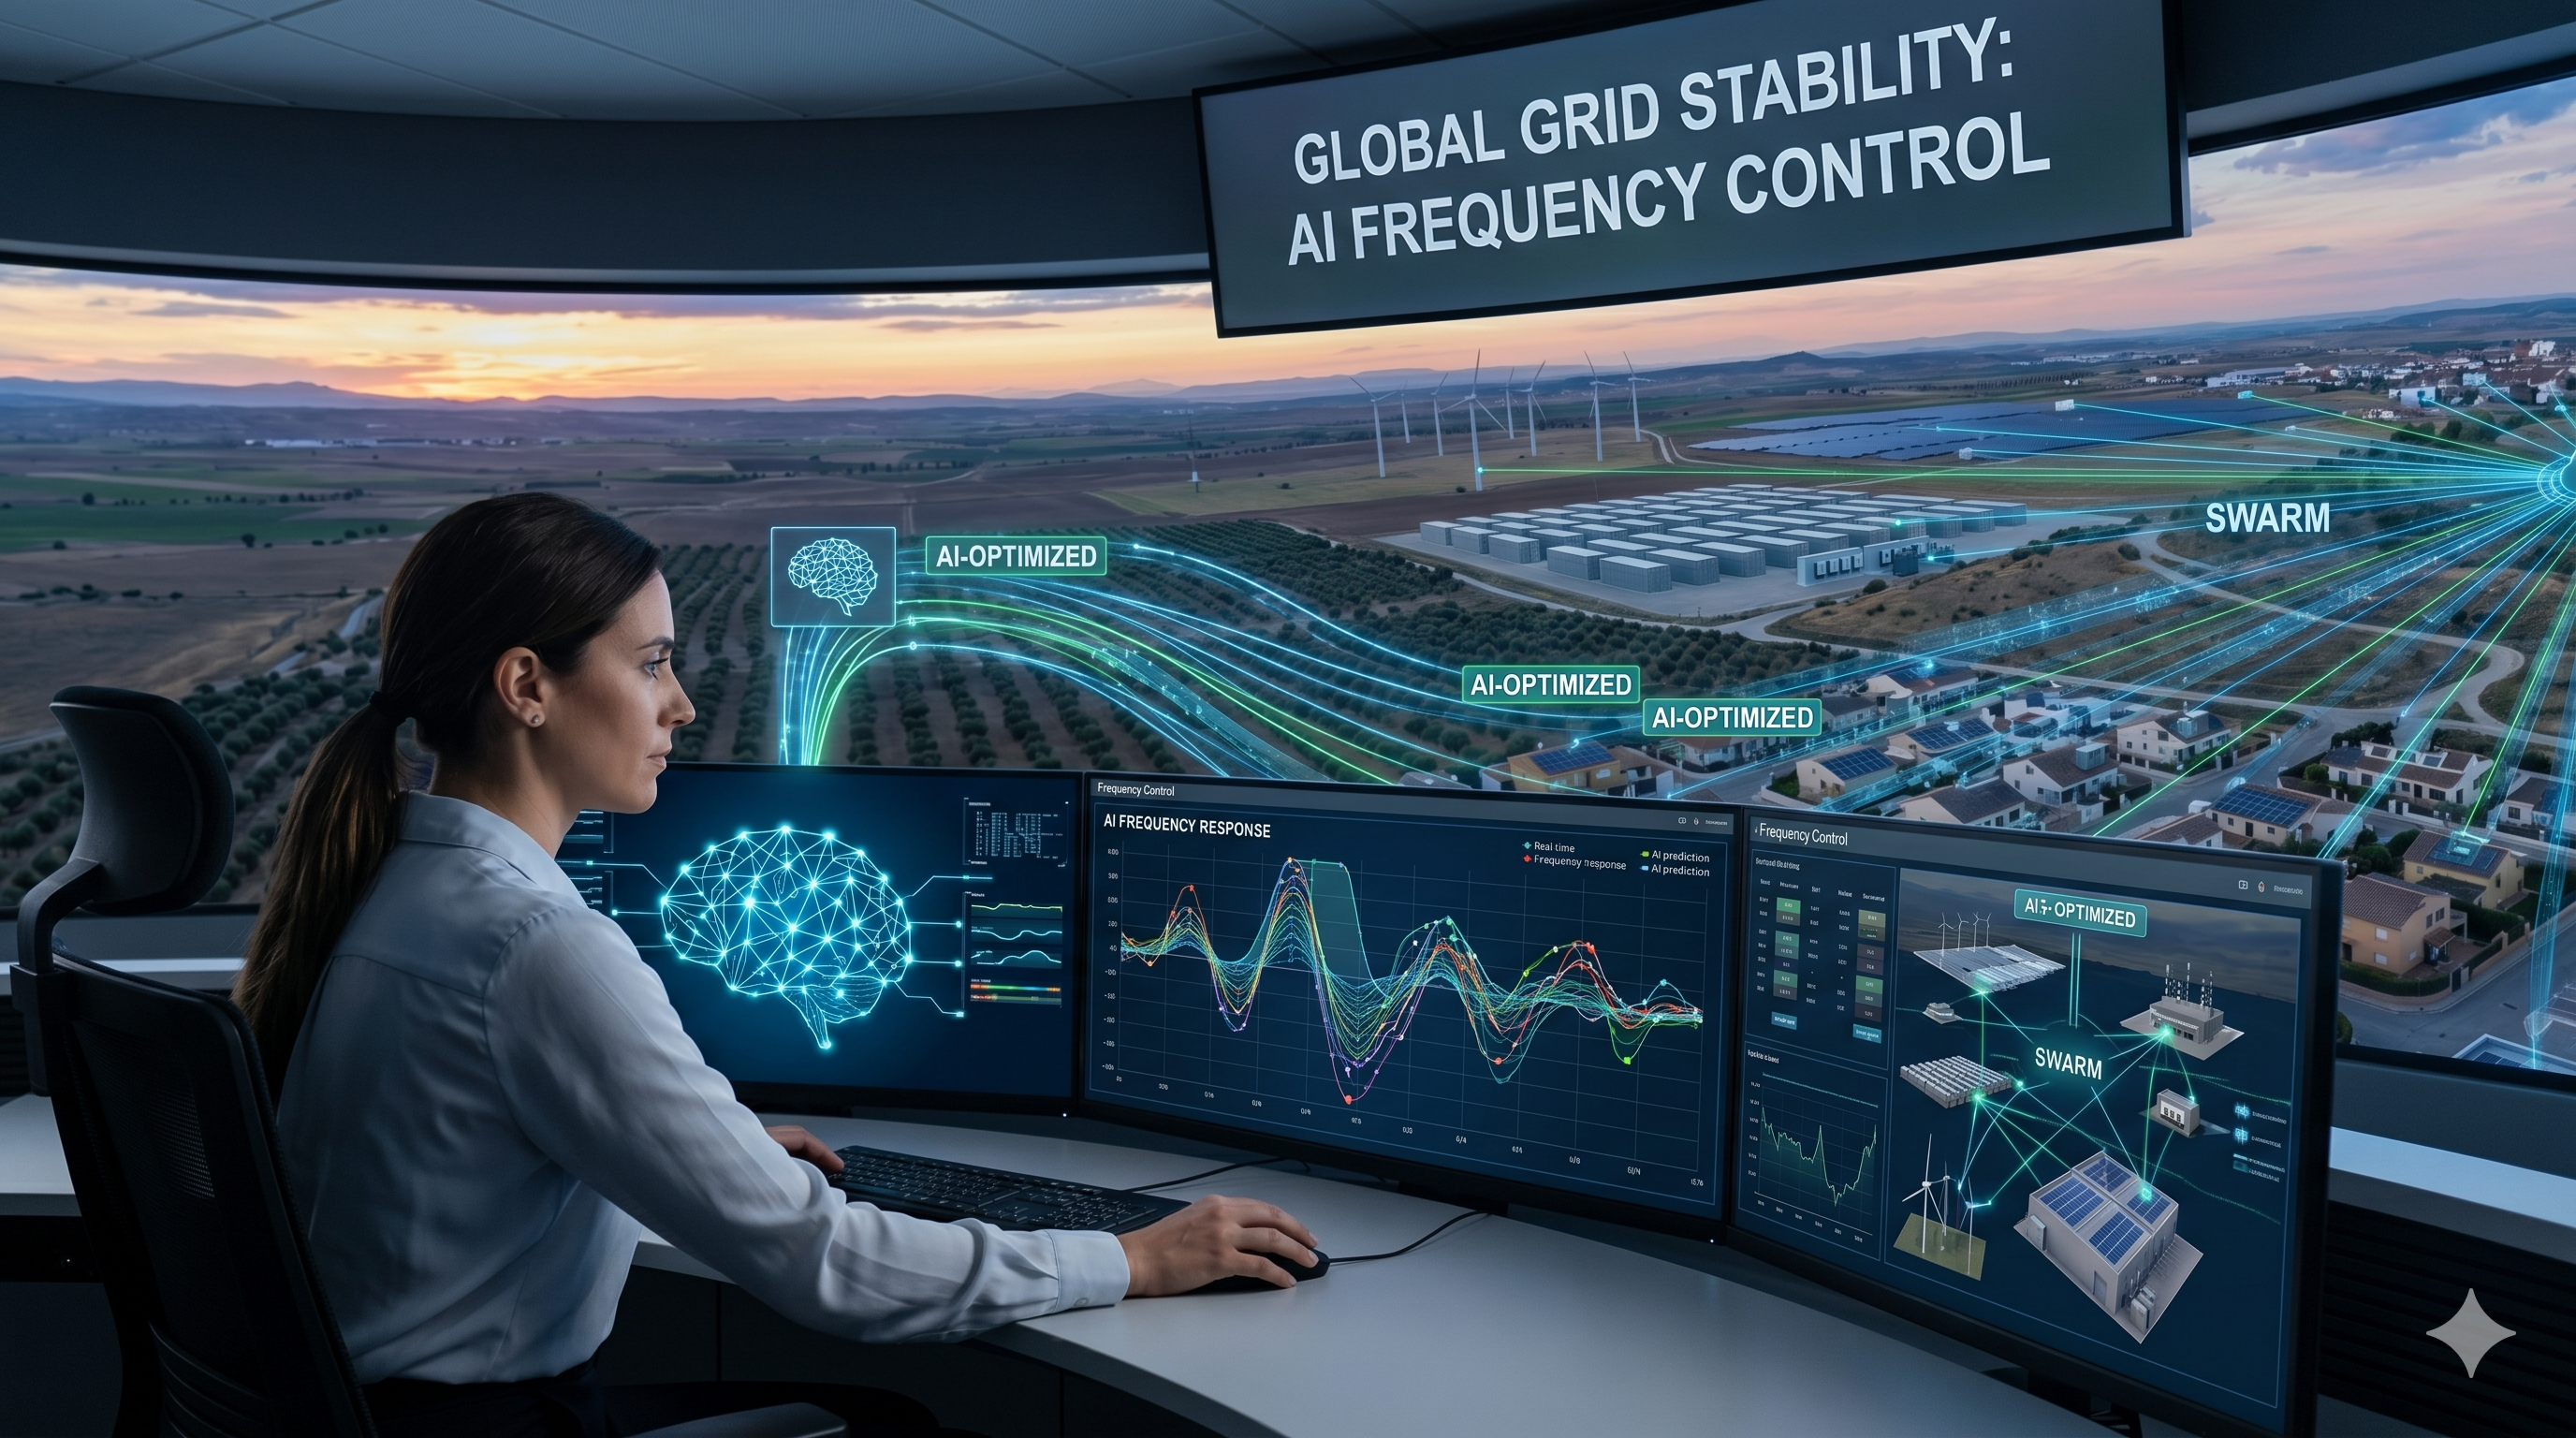
Grid frequency reflects the real-time balance between electricity generation and consumption. In many European systems, the nominal frequency is 50 Hz; in several other regions it is 60 Hz. When generation exceeds demand, frequency tends to rise. When demand exceeds generation, frequency tends to fall.
AI-supported frequency control does not replace protection systems or grid codes. Its role is to improve monitoring, forecasting and fast coordination of flexible resources such as battery storage, inverter-based generation and controllable loads.
| Aspect | Conventional Approach | AI-Supported Grid Management |
|---|---|---|
| Response logic | Rule-based and protection-driven | Forecast-assisted and resource-aware |
| Inertia support | Mechanical inertia from synchronous machines | Synthetic inertia from inverters and storage |
| Operational view | Reactive stabilization | Predictive balancing and early warning |
Dynamic Line Rating
Transmission lines have thermal and mechanical operating limits. Traditional static line ratings define maximum capacity using conservative assumptions. Dynamic Line Rating adjusts the usable capacity of lines based on real-time environmental and asset conditions.
Wind cooling, ambient temperature, solar heating and conductor behavior can significantly change how much current a line can safely carry. DLR helps grid operators reduce congestion by using existing infrastructure more accurately.
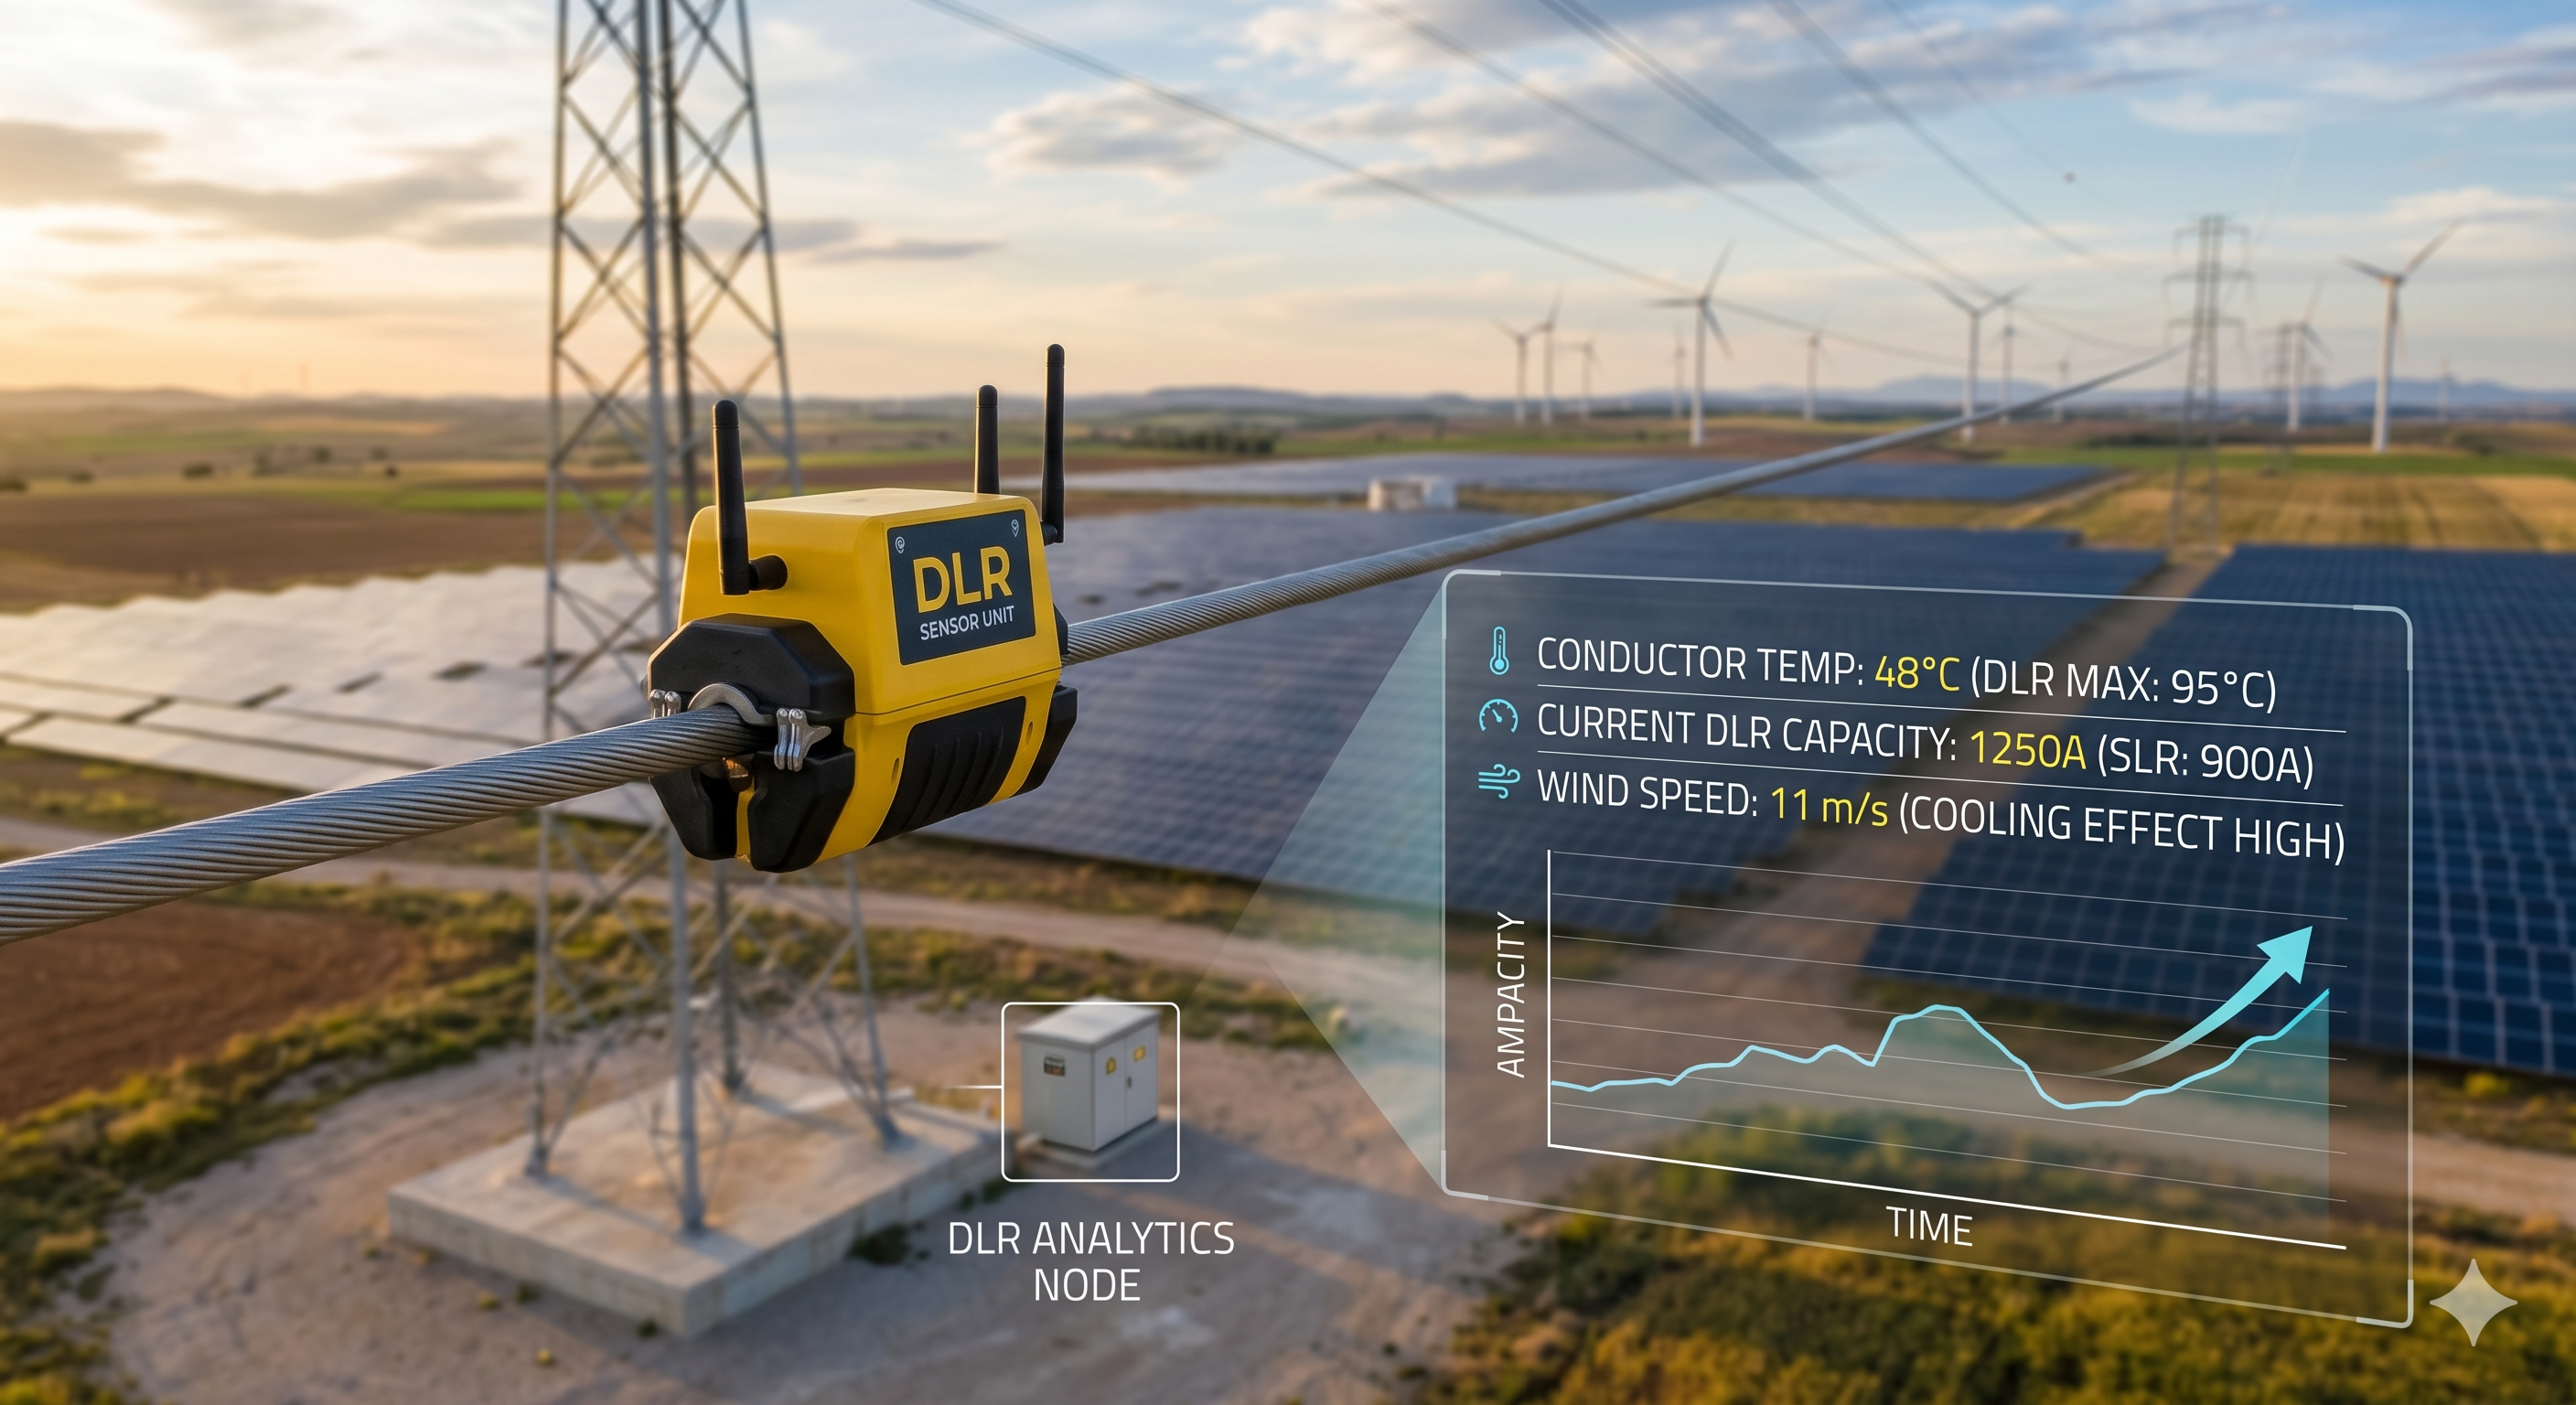
Typical DLR data inputs
| Input | Purpose |
|---|---|
| Ambient temperature | Estimates thermal loading and cooling potential. |
| Wind speed and direction | Determines convective cooling of conductors. |
| Solar radiation | Accounts for additional heating from sunlight. |
| Conductor temperature or sag | Validates whether the line remains within safe operating limits. |
Optimal Power Flow & Congestion Management
Optimal Power Flow is a mathematical framework used to determine how electricity should flow through the network while respecting physical limits, security constraints and cost objectives. In congestion management, it helps decide which generators, storage units or flexible loads should adjust their behavior.
AI can support OPF workflows by improving forecasts, detecting abnormal grid states and accelerating decision support. However, final control actions must remain compatible with grid codes, protection systems and operator validation requirements.
| Problem | Operational Consequence | Management Approach |
|---|---|---|
| Transmission bottleneck | Redispatch, curtailment or overload risk | DLR, OPF and flexible resource dispatch |
| Renewable volatility | Rapid power-flow changes | Forecasting, storage activation and reserve planning |
| Low inertia condition | Faster frequency deviations | Synthetic inertia and fast frequency response |
Reference Architecture
A smart grid management layer combines field telemetry, grid models and operational decision logic. It typically does not operate independently from grid control centers; it augments situational awareness and supports faster, more informed actions.
| Layer | Function | Examples |
|---|---|---|
| Field layer | Captures real-time electrical and environmental conditions | PMUs, SCADA, sensors, weather stations |
| Data layer | Normalizes and validates operational data | Telemetry streams, historian data, weather feeds |
| Model layer | Forecasts risk and simulates power-flow behavior | Load forecasts, DLR models, OPF models |
| Decision layer | Recommends or coordinates corrective actions | Redispatch, storage dispatch, demand response, alerts |
Key Performance Metrics
Smart grid management is evaluated through stability, congestion, asset utilization and operational response indicators.
Limitations & Practical Considerations
Grid management systems operate in safety-critical environments. Model outputs must be explainable, validated and compatible with protection schemes, grid codes and operator procedures. Poor data quality or unrealistic model assumptions can create false confidence.
Dynamic automation should usually be introduced gradually: first as monitoring and advisory systems, then as supervised control support, and only later as partially automated operational workflows where regulation allows it.