Global Energy Monitoring
Global energy monitoring uses satellite observations, remote sensing, trade data, infrastructure databases and simulation models to improve visibility into energy production, transport and risk. The goal is to reduce reliance on delayed self-reporting and create a more evidence-based view of global energy systems.
Global Monitoring Pain Points
Global energy systems are difficult to monitor because production, transport and consumption data are fragmented across countries, operators, markets and reporting regimes. Official data can be delayed, restricted or inconsistent.
Remote sensing and simulation can improve situational awareness, but they do not provide perfect visibility. They must be interpreted carefully and validated against ground data, market data and physical constraints.
Satellite Tracking & Remote Sensing
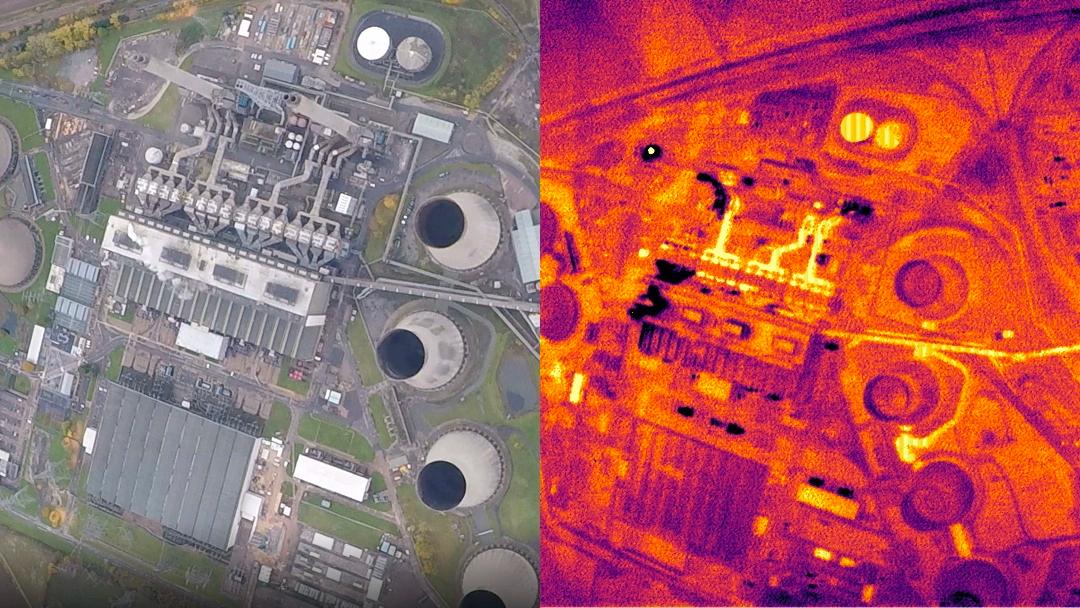
Satellite tracking can provide independent evidence of activity across energy infrastructure. Thermal imagery, optical imagery, synthetic aperture radar and night-light observations can support estimates of activity at power plants, refineries, LNG terminals, solar farms, wind assets and transport corridors.
This is best framed as physical evidence and probabilistic intelligence, not absolute ground truth. Satellite-derived insights require calibration, context and uncertainty handling.
| Data Type | Potential Use | Limitation |
|---|---|---|
| Thermal imagery | Detects heat signatures from industrial assets | Requires calibration and may be affected by weather or sensor resolution |
| Optical imagery | Tracks visible infrastructure, construction and asset changes | Cloud cover and daylight dependency can limit availability |
| SAR imagery | Supports observation through clouds and at night | Interpretation can be complex and requires specialized models |
| Night-light data | Supports macro-level activity estimates | Low spatial specificity for individual assets |
Global Simulation & Strategic Foresight
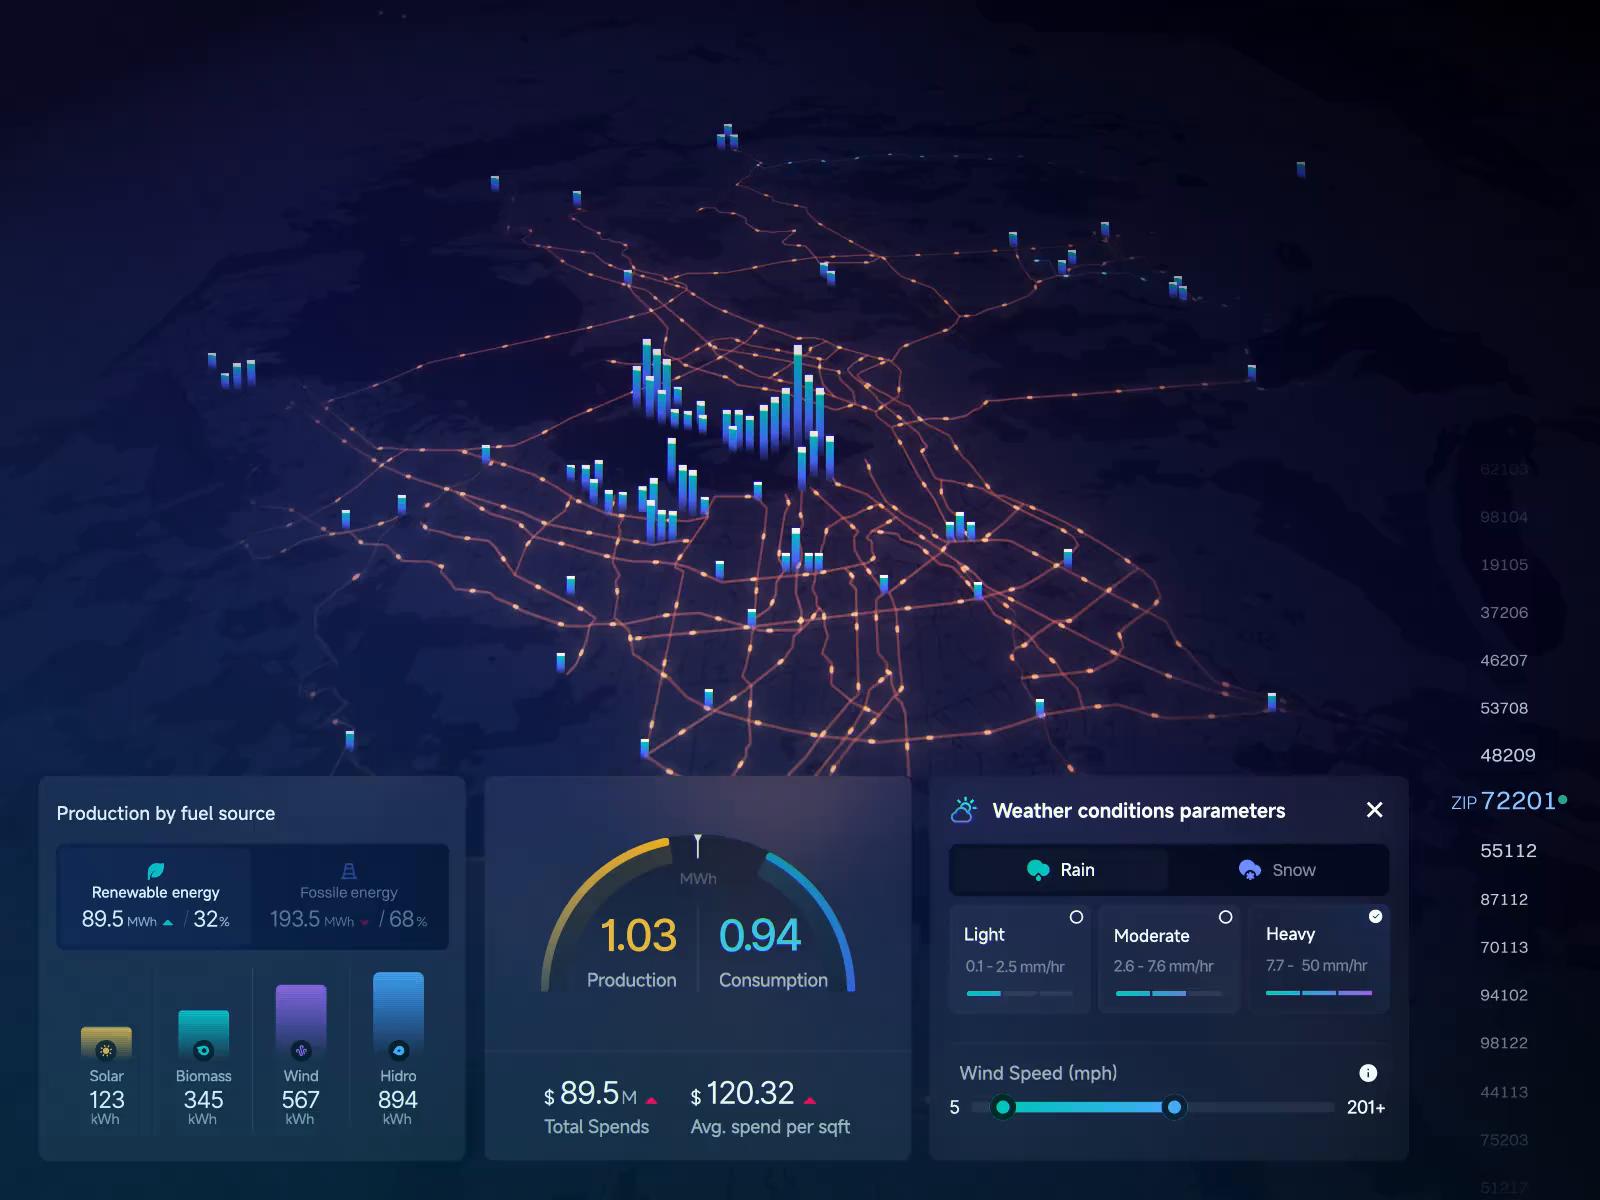
Global simulation connects observed energy activity with market, trade, policy and infrastructure variables. Instead of relying only on static forecasts, simulation models can test scenarios such as supply disruptions, demand shocks, weather extremes or geopolitical constraints.
These models are useful for strategic planning, but they are not predictions with guaranteed outcomes. Their value depends on transparent assumptions, scenario design and continuous comparison with observed reality.
| Approach | Strength | Risk |
|---|---|---|
| Static forecasting | Simple and explainable | May fail under structural change or shocks |
| Scenario simulation | Tests multiple plausible futures | Depends heavily on assumptions and parameter choices |
| Observation-linked simulation | Updates scenarios with physical and market evidence | Requires strong data governance and validation |
Monitoring Architecture
A global energy monitoring system combines satellite data, external market data, asset registries, inference models and scenario engines. The architecture should preserve provenance, uncertainty and validation status for every derived signal.
| Layer | Function | Examples |
|---|---|---|
| Observation layer | Collects physical and remote sensing signals | Satellite imagery, AIS, weather, night lights |
| Asset layer | Maps observations to known infrastructure | Power plants, refineries, LNG terminals, pipelines |
| Inference layer | Estimates activity, production or operational state | Computer vision, thermal models, change detection |
| Simulation layer | Tests scenarios and systemic risks | Monte Carlo models, energy system models, supply chain simulations |
| Decision layer | Converts intelligence into dashboards, alerts or planning inputs | Risk scores, monitoring feeds, strategic reports |
Key Performance Metrics
Global monitoring should be evaluated by observation quality, update frequency, uncertainty handling and decision usefulness.
Limitations & Practical Considerations
Global monitoring is powerful but imperfect. Satellite data does not equal full operational truth. Sensor resolution, revisit frequency, cloud cover, data licensing, geopolitical restrictions and model uncertainty all affect reliability.
The best systems combine remote sensing with market data, engineering constraints, reported data and human validation. Claims such as “complete planetary visibility” or “real-time global production certainty” should be avoided unless carefully qualified.
Energy Wiki Link Map
Global monitoring connects market intelligence, energy security, renewables and grid operations into one wider energy knowledge system.